A Multi-Hat Journey to Condition Monitoring and Predictive Maintenance
How I Applied Expertise in Maintenance Management, DevOps, Data Engineering, and Data Science to Implement a Complete Predictive Maintenance Solution with Amazon Monitron and Grafana
Over the past few weeks, I have immersed myself in a journey focused on condition monitoring and predictive maintenance. This experience has been both challenging and extremely rewarding, pushing me to utilize my expertise across various fields. This project has allowed me to apply my knowledge in maintenance management, DevOps, data engineering, and data science.
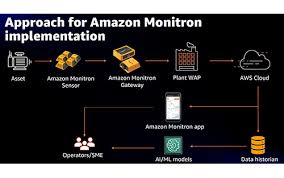
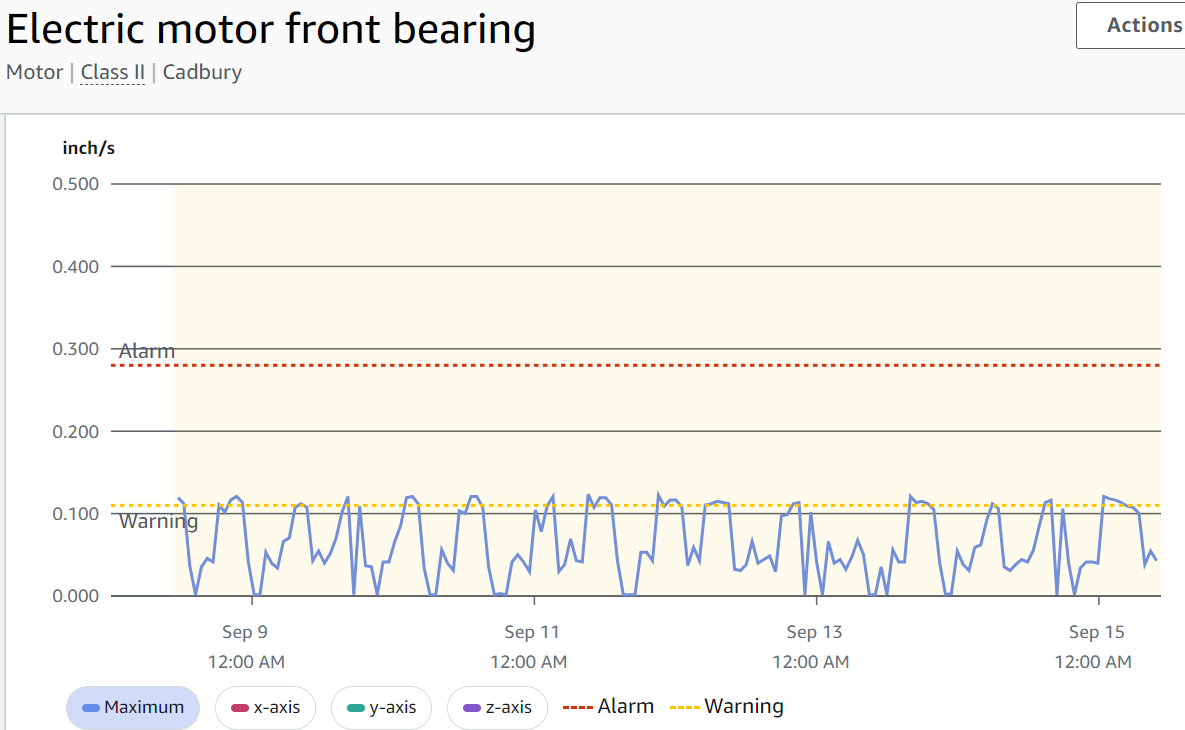
In terms of maintenance management, I leveraged my understanding of what needs to be monitored, the significance of various parameters, and the best practices for measurement. By focusing on vibration and temperature monitoring, I learned that over 70% of mechanical failures can be detected through changes in these metrics. Vibration monitoring, in particular, is a comprehensive approach that provides a wealth of useful data, including acceleration in the x, y, and z axes, velocity, crest factor, and temperature across frequency bands from 0 to 6000 Hz. These parameters can help identify anomalies in bearings, gearboxes, electric motors, pumps, and other equipment, revealing different failure modes such as lack of lubrication, pump cavitation, misalignments, and excessive wear.
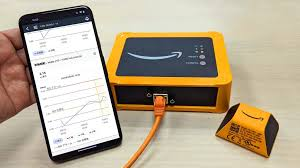
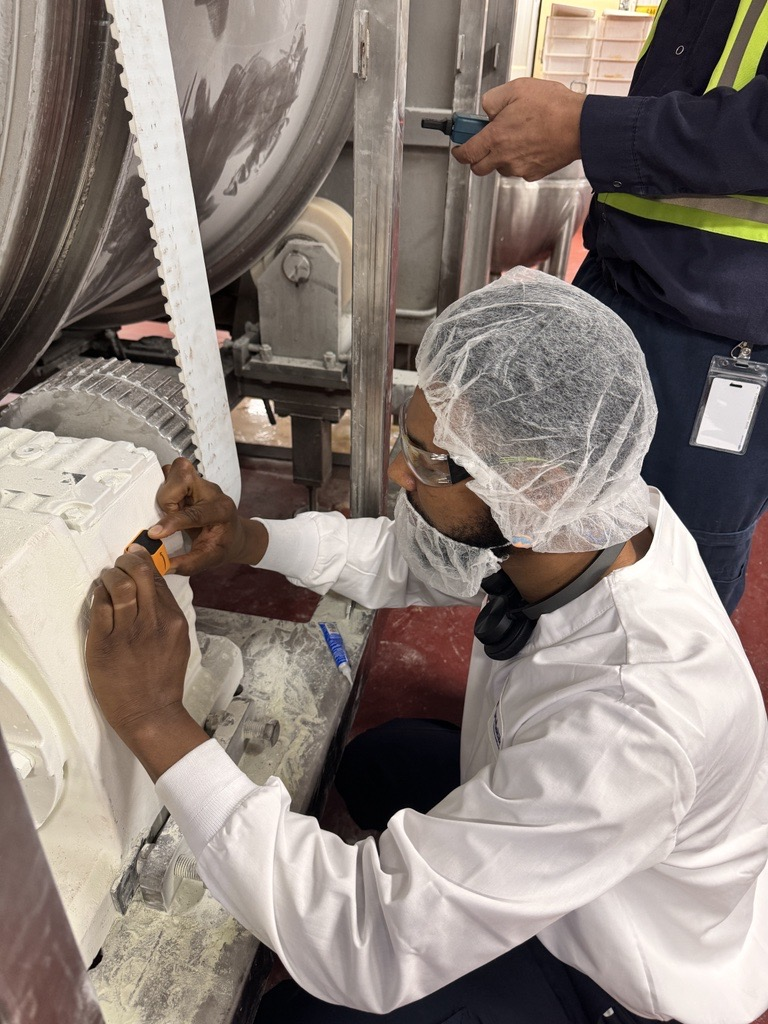
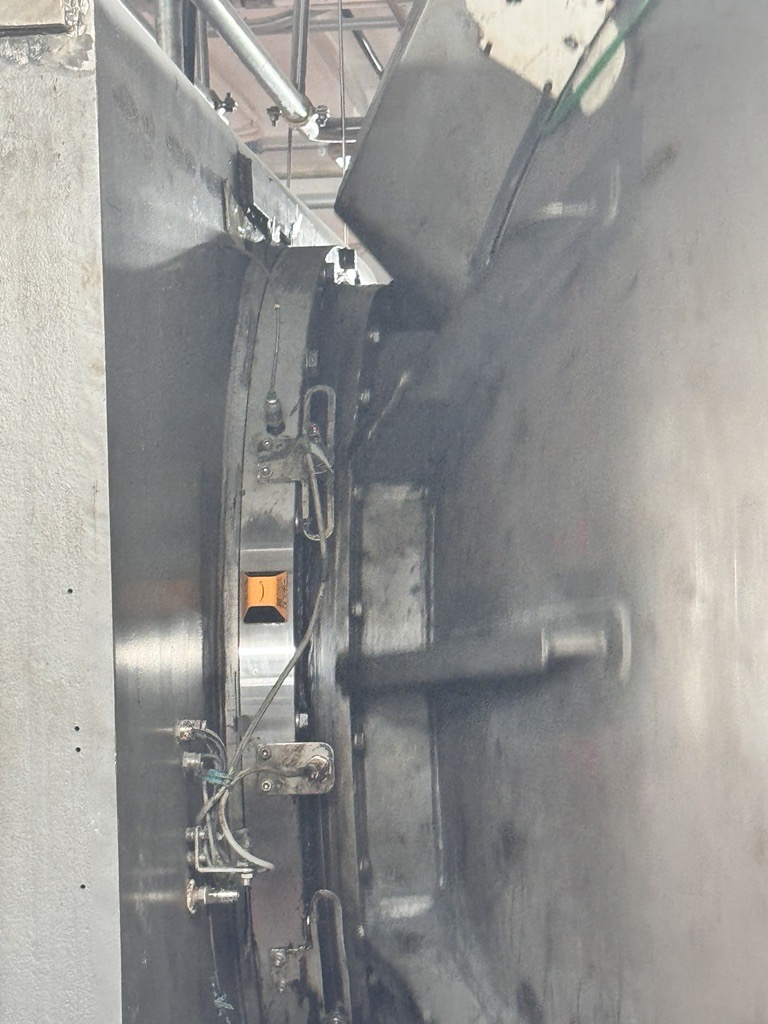
The next critical step was selecting the right technology for sensors, gateways, cloud storage, and visualization. This is where my expertise as a DevOps engineer became invaluable. After thorough research, I determined that Amazon Monitron was the best option available. Amazon Monitron is a fantastic end-to-end system for condition monitoring. It is seamless, secure, and highly effective, built on the AWS IoT framework, and can easily integrate with other Amazon services. This integration was crucial, as one of my top priorities was the ability to stream data and apply statistical modeling and machine learning algorithms for predictive maintenance.
Once the configuration was complete, the next step was to obtain live and clean data for further analysis. It was time to don my data engineering hat. I configured a live stream using Kinesis Firehose to stream data to an S3 bucket. This was just the beginning. The next task was to define the data schema, which I accomplished using AWS Glue and a crawler to create a data catalog that can be queried with Athena. It was a relief to use SQL to query my data, but it’s essential to understand the schema and the meaning of all parameters before performing any analysis. In fact, knowing what analysis to conduct and the implications of each result is crucial.
Now it was time to wear the ultimate hat of a data scientist. This is my favorite part. I opened Google Colab, connected my Python environment to stream data from my S3 bucket, provided the necessary permissions, and successfully accessed my data in Jupyter.
Just then, the client presented a new request: “Thank you for visualizing all the vibration and temperature data for our equipment. We see value in this, but we want to project this dashboard across the plant.” I replied, “Fair enough, that’s easy with televisions and projectors.” After setting up all the displays, guess what? Oliver asked for more. They wanted a summary dashboard for the Operational Technology and Management team to have a holistic view of the status of all machines, sensor positions, and additional insights.
This requirement was outside the scope of Amazon Monitron. What next? I had to put on my DevOps hat again to configure a Grafana dashboard for visualization and alerts. Initially, I started with AWS-managed Grafana, but the Athena plugin is not free and requires an enterprise account. I suppose AWS and Grafana need to make their money. I was uncomfortable with the additional costs, as expenses were already accumulating with the various services I was utilizing. What was the next best solution? As a DevOps expert, I needed to figure something out. Challenge accepted!
I launched an EC2 Linux instance with my favorite Ubuntu OS, configured the AWS CLI, granted the necessary permissions, and tested to ensure my S3 bucket was accessible. I installed Grafana, configured the firewalls, and exposed port 3000. Boom! 💥 Grafana was live. I installed the Athena plugin (the reason I left the managed version), connected the data source, saved, and tested it. Guess what? Successful connection!
Now it was time to wear the data scientist hat once more. This time, not with Python, but with the almighty SQL. I ran my first query successfully. I returned to AWS Glue, ran the crawler to refresh my tables, and it was successful. However, when I went back to Grafana to run the SQL query again, I encountered errors. I thought to myself, “Welcome to the game. It’s time to earn your keep.” This troubleshooting was not going to be easy. My event payload is a struct data type with over 20 parameters.
The solution is often simple, and that’s the beauty of technology. I discovered that each time I ran the crawler, it changed the schema, causing mismatches. I advised my colleague that once you’ve established your initial schema using the crawler, avoid tampering with it. I found a sustainable solution: there was a site without sensors that returned null values, so I edited the crawler to ignore it.
With clean data ready, it was time for the data scientist to work their magic. But what is clean about a payload of struct data type with over 20 nested parameters? Oh, I was the one wearing all the hats! 👒 It was JSON data, so no big deal. I went to my Python environment to manipulate the data and flattened everything. Yes, now it made sense. It was time to return to Grafana and start creating dashboards. But wait, what does VibrationISO.PreviousPersistentClassificationOutput mean? Flattening the data was the best data cleaning action for this project.
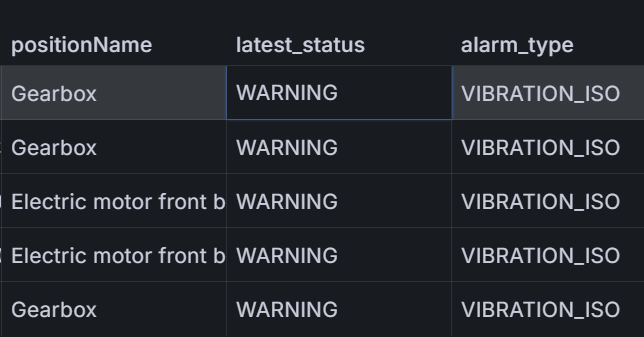
Now it was time to wear the Maintenance and Reliability Engineer hat. I needed to check the meaning and interpretation of all parameters in the payload, test and confirm their implications, and verify event types and their various payload content. Good job! 👦 Let’s create the dashboard together with the data scientist. Now we have a beautiful dashboard featuring complex SQL queries and Grafana charts.
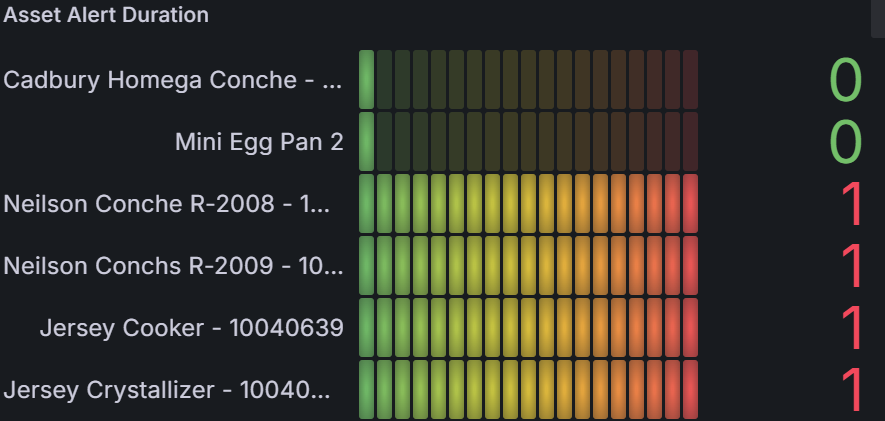
My buddy ChatGPT was helping out with errors. At first, she was confused, but I had to provide my data schema to ensure she understood it before she could offer real assistance.
What a success! The next phase is to explore different statistical and machine learning models for predictions. This is outside the scope of the project, but trust me, if you find a project that encompasses all your expertise, you won’t want to stop.
Feel free to book a call and ask me anything about condition monitoring, predictive maintenance, or Amazon Monitron.
Share your thoughts with me in the comment section!

